SOP - NonInvasive Blood Pressure --PUBLIC
NonInvasive Blood Pressure
The Non Invasive Blood Pressure Protocol (NIBP) is typically performed over the course of five consecutive days. It is recommended to start early in the day on Monday so you can begin the first phase of the protocol, “Acclimatization.” This phase will last 3 days (Monday-Wednesday) and will be immediately followed by the “Recording” phase, last 2 day (Thursday-Friday). You will then have to analyze the signals, but this can be done at a different time without the mice present.
Purpose
This test provides an assessment of blood pressure in rodents using a non-invasive tail-cuff system.
Experimental Design
Minimum number of animals: Recommend at least 5 animals per group being compared
Age at test: recommended at least 6 wks of age
Sex: either
Time of Day: typically during the light phase, but may vary depending on study requirements
Equipment
IITC Non-Invasive Blood Pressure System Cleaning Supplies (Activated Hydrogen Peroxide, Quat-Ammonia Wipes, Paper Towells)
Procedure
Initializing MRBP System
- Verify that unit #1-3 are receiving power (turn on Unit #1 and make sure fan is blowing in all units). If one is turned off, make sure that the power cable in the back is plugged in.
- Verify all units are plugged into the USB splitter, and USB splitter to computer.
- Launch BpMonWin.exe. The currently selected unit will load the previously collected data.
- Click the check boxes (if not already checked) to activate all units.
- Select each unit individually to load the previously collected data and verify that the unit is communicating with the software.
Configuration Settings
- Open configuration settings: Accessed through “Options” > “Configuration…”.
- Recommended Settings
- Start pressure: 160-180 mmHg
- Termination pressure: 50 mmHg
- Setpoint temp: 30-34 degrees C
- Trigger level: 100 mV
- Trigger reset: 1.00 sec
- Runs: 3
- Delay: 99 sec
- Gain: 640-2560 (mice) 80-160 (rats)
- Check ‘Apply to all units’
- Overwrite retests: No
- Prompt for file save: No
- Report Format: Delimited
The ideal temperature threshold to capture NIBP is 34-36 degrees C. However, we keep the setpoint temp between 30-34 degrees C because the instrument has a tendency to run hotter than the specification. You should monitor the temperature of each chamber with a thermometer any time a mouse is inside.
Cleaning the instrument
- The instrument and its components should be cleaned with SOAP AND WATER.
- DO NOT USE HARSH CHEMICALS such as bleach, ammonia, or alcohols which may leave irritating residues or damage the plastics of the restraint tubes.
- For spot cleaning during testing, you may use activated hydrogen peroxide cleaner.
- Please dry thoroughly before letting a mouse contact the surface.
- Before placing mice in the instrument, ensure the restraint tubes, tail cuff, and metal tray are clean.
- During an experiment, clean as needed to minimize exposure between animals to urine, feces (this may be a stressor if not cleaned between animals and may be a contamination hazard if not cleaned between cages/groups).
- After the experiment, clean the restraints and metal tray with soap and water.
Acclimatization (Day 1-3)
- Place all restraints to be used inside the chambers.
- Initialize the system (follow “Initializing MRBP System” protocol above).
- Set-up temperature.
- Input setpoint temperature.
- Allow approximately 10 minutes for chambers to warm up.
- Use a thermometer to verify temperature is correct.
- Place mice in restraints with tape, and then place restraints with mice back into chambers. (Alternatively on Day 1 you may want to place the mice in their home cage for the habituation period)
- Monitor the animals closely. If animals appears highly stressed, remove from chamber and allow it to acclimate in home cage instead.
- Allow mice to acclimatize in chamber and/or home cage for 20 minutes.
- Once all of the mice have had a chance to acclimatize, turn off the system and wash the restrains, metal trays, and covers with gentle soap and water.
Recording BP (Day 4-5)
- Inspect pressure cuff and replace latex tube and o-rings as needed (likely needed weekly for latex tube)
- Initialize the system (follow “Initializing MRBP System” protocol above).
- Warm up restraints and chambers and verify temperature is within threshold using thermometer.
- Place mice in restraints/chambers and attach tail cuff to the back of restraints.
- Record animal IDs in the configuration settings. and use a unique name for the group (recommend PI initials, 6 digit date, and test number - e.g. CW122523-01)
- Changing the group name keeps the software from automatically saving over previously recorded files.
- Allow the mice to acclimatize for 10 minutes before recording.
- Click ► to begin recording.
- Toggle in between units by selecting them on the top menu.
- Follow the “Pulse Quality Control” protocol to determine whether or not it is usable.
- Monitor the mice and chamber temperature closely throughout experiment
- Remove the mice that produced a successful recording from their restraints and place them back into their cages. Leave any mice that produced a noisy recording, so they can be retested - or try retesting at the end of the cohort.
- Place new mice into any empty restraint and allow 10 minutes for acclimatization before beginning testing the next group. If no mice produced “good” signals, you may instead wait 2-5 minutes for their tail vessels to reset then take another measurement.
Pulse Quality Control
- While you are acquiring and analyzing data you will need to be able to distinguish “good” signals from “bad” signals.
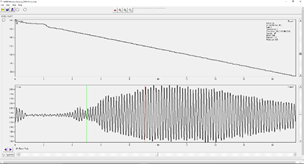
- A “good” signal will look similar to the following figure. Note the clarity of the pulse wave.
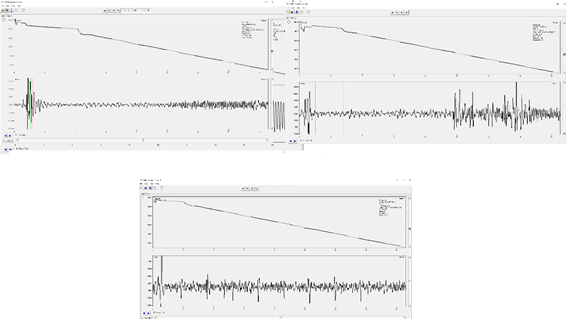
- A “bad” signal will look similar to one of the following figures.
- In the top left example you can see some signal but the start point and maximum intensity of the pulse wave is not very clear because the gain is set too low. You would want to increase the gain and take another measurement if your signal looks like the top left.
- In the top right, you can see a signal hidden beneath “movement artifacts.” These artifacts are caused by movement of the tail or another part of the body that caused detection of noise instead of pulse signal. These artifacts may prevent you from marking a clear start point for the pulse.
- The bottom image shows no pulse at all and only a flat line is shown beneath several movement artifacts.
Pulse Analysis
- Launch Bpmonitor.exe
- Check the From Disk check box in the bottom left corner, if not already checked.
- Click the folder icon Add
- Select the first .mrd file that you would like to analyze and click Open. Note: the software only lets you add one file at a time.
- Add any more .mrd files that you’d like to analyze together.
- Click Ok, once you have selected all the files that you would like to analyze together.
- Determine whether or not the first file in the series contains a clear pulse and is free of noise artifacts (See “Pulse Quality Control” Protocol)
- Press the F9 key, if you wish to exclude a recording from you report. Note: the word “Report” disappears from the upper right corner. If you have determined the data is not usable, click the right facing arrow at the bottom left corner to move on to the next recording. If not, move on to the next step.
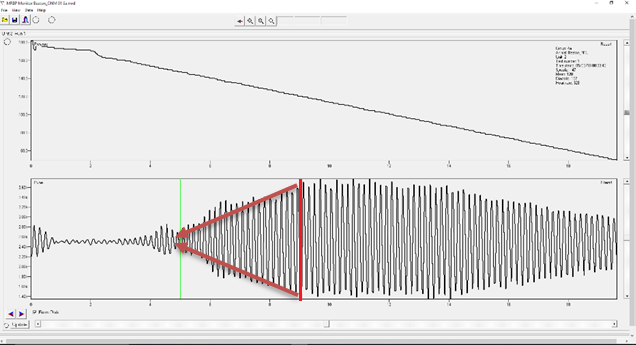
- Click the right mouse button at the beginning of the thickest section of the pulse to place the mean marker (red).
- Hold a straight edge (i. e. a piece of paper or ruler) against your monitor, to create a linear trend line from the mean marker to the center of the pulse. You should imagine the point of a triangle where the trend lines meet. # # Ignore any part of the pulse that extends past this point, and click the left mouse button to place the systolic marker (See Figure 1).
- Imagine the base of the triangle you created. This should be where the pulse signal is at its widest. Click the right mouse button to place the Mean BP marker. The systolic BP and the mean BP is used to calculate diastolic bp. You should not place the mean marker unless there is a clear trend line that allows you to see the widest portion of the pulse wave. If you need diastolic and mean BP you should analyze a different recording.
- Click the right facing arrow to move on to the next recording, and repeat until you have reached the last loaded recording.
- Click File > Make Report
- Open the .csv file created in the same file location as the files selected for analysis.
- You may average the individual recordings or use the daily average for an animal.
Data Outcome Measures Produced
Common parameters of interest
- Systolic Blood Pressure : measured directly, the pressure where the pulse of the mouse is detectable from the base of the tail
- Mean Blood Pressure: measured directly, the pressure where the amplitude of the pulse reaches its miximum
- Diastolic Blood Pressure : calculated from the systolic and mean bp. based on the relationship : MeanBP = DiastolicBP + 1/3 (SystolicBP - DiastolicBP)


